It had been YEARS since I had an excuse to break out a pack of baseball cards in class, but this week, we had a rudimentary lesson on sabermetrics (the study of baseball statistics) to reinforce what my seventh-graders have been learning about ratios, percentages, and averages.
For the first lesson, I did a quick overview of three relatively simple stats: batting average, fielding percentage, and ERA. Each of these stats is pretty easy to understand and to calculate.
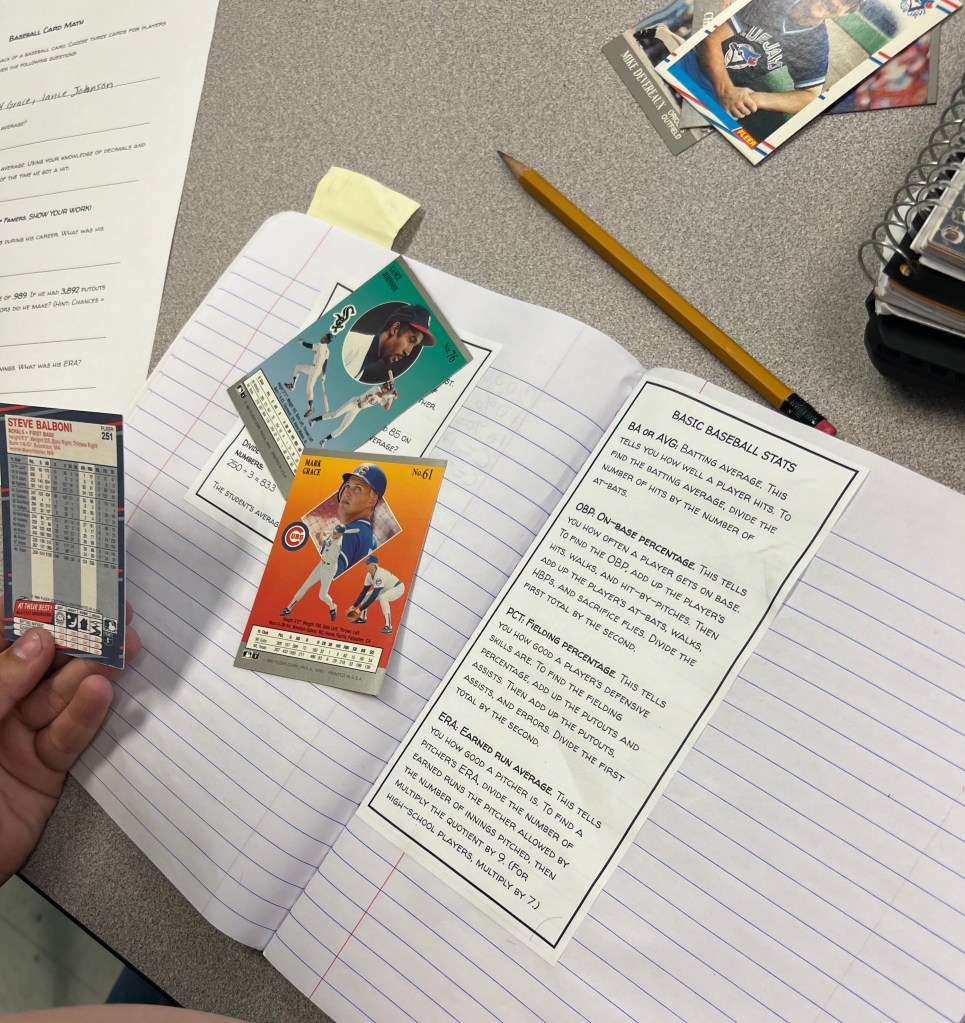
I made a cheat sheet with the definition and formula for each stat, plus OBP (which we didn’t end up using for this lesson but might play with later), and had the kids paste it into their notebooks so they’d have everything they needed to work with the numbers.
I used to have a pretty respectable baseball card collection, but I gave it to my softball-obsessed goddaughter and her older sister about 10 years ago, when I didn’t think I’d be teaching math again, so my first order of business was to scrounge up some cards. I found a bundle of seven old ’80s and ’90s wax packs on Amazon for $11.50 and let the first group of students have the fun of opening the packs to see what was inside (with a careful admonition not to chew any gum they found inside, as it was likely to be older than their parents).
I put the kids in groups of two or three and gave each group a wax pack and a handout containing the following text:
Baseball Card Math
There’s a lot of math on the back of a baseball card. Choose three cards for players who are not pitchers and answer the following questions:
1. Who are your three players?
2. Which player has the best batting average?
3. Choose one player. Look at his batting average. Using your knowledge of decimals and percentages, determine what percentage of the time he got a hit.
Now, let’s look at some of my favorite Hall of Famers. SHOW YOUR WORK!
4. Ted Williams had 2,654 hits in 7,706 at-bats during his career. What was his lifetime batting average?
5. Ryne Sandberg has a lifetime fielding percentage of .989. If he had 3,892 putouts and 6,648 assists in 10,660 chances, how many errors did he make? (Hint: Chances = putouts + assists + errors.)
6. Mariano Rivera allowed 315 earned runs in 1,283.2 innings. What was his ERA?
Question 2 seemed easy enough, but I quickly realized that most of the kids had no idea how to find information on the back of a baseball card, so we had to do a quick mini-lesson on that. (Fleer’s weird habit of using “PCT” to mean batting average instead of fielding percentage didn’t help.) Question 3 tied into our recent study of percentages, while Question 4 helped build their confidence. Question 5 was a bit of red herring, because the kids’ cheat sheets contained the formula for calculating fielding percentage, but the question itself really only required them to find the difference between Sandberg’s chances and his successful plays. The math is easy, but they had to slow down and think about the question, which is challenging for them. Meanwhile, Question 6 was easy for the kids who referred to their notes, but those who tried to work from memory got it wrong because they forgot to multiply the ratio of ER to IP by 9 to get the answer.
Assuming the kids cooperate, tomorrow’s lesson — which is based on one I did about 12 years ago in Tulsa — should be even more fun. If it goes smoothly, I’ll share it.
